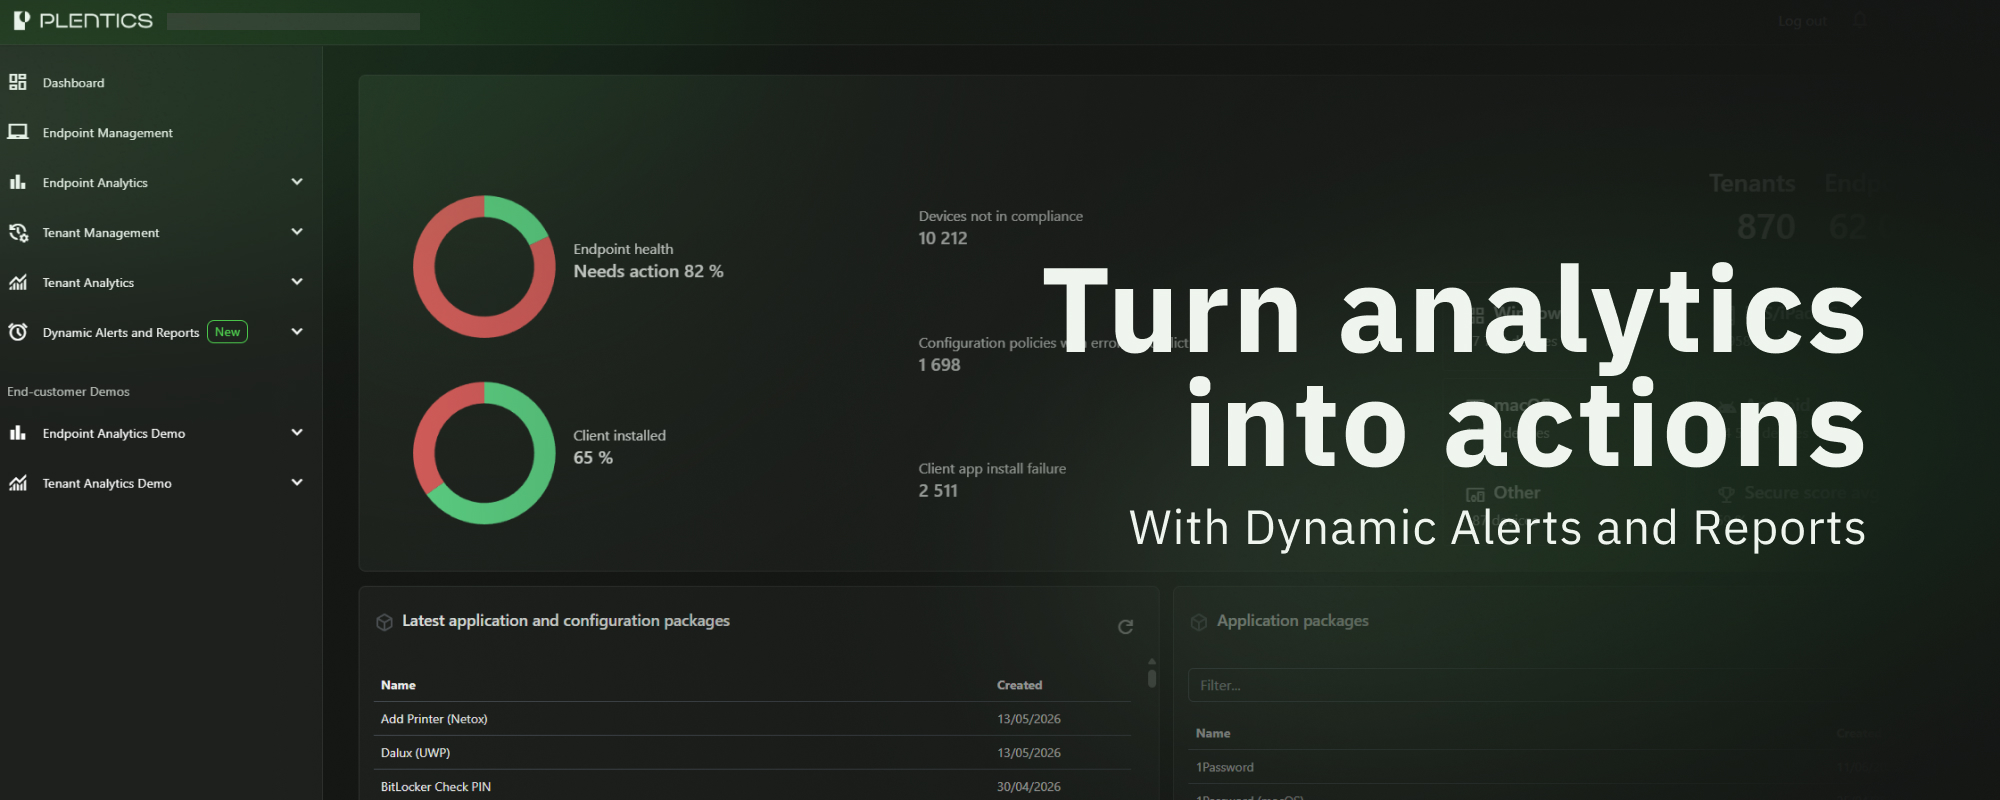
Plentics Suite now makes it easier for MSPs to turn their customer data into timely action. With the new Dynamic Alerts and Reports feature, partners can create and manage analytics-based alerts and scheduled customer reports directly in the UI — helping teams stay proactive, reduce manual reporting work, and keep customers better informed across every managed Microsoft Intune environment.
Managed Service Providers do not need more dashboards. They need the right information to reach the right people at the right time.
That is exactly what the new Dynamic Alerts and Reports feature in Plentics Suite is built for.
With this release, partners using Plentics Analytics capabilities can now create and manage dynamic alerts and scheduled reports directly in the Plentics Suite UI. Alerts and reports are based on Endpoint Analytics and Tenant Analytics data, helping MSPs monitor customer environments more proactively, automate routine reporting, and reduce manual follow-up work.
From visibility to action
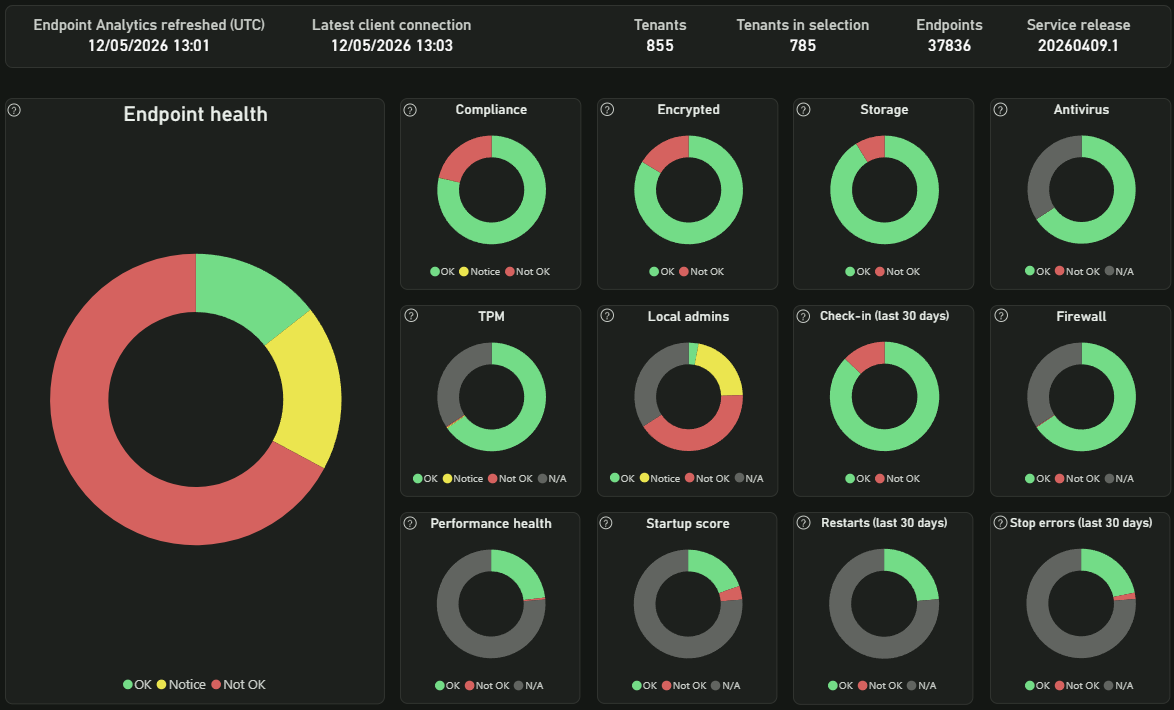
Dynamic Alerts and Reports takes that visibility one step further.
Instead of manually checking dashboards or exporting data for recurring customer updates, partners can now configure alerts and reports that run automatically based on selected analytics data.
This means your teams like
- service desk,
- local support,
- endpoint management engineers,
- M365 specialists,
- service managers,
- etc.
can stay ahead of issues before they become service requests, while keeping customers informed with less manual effort.
What is new?
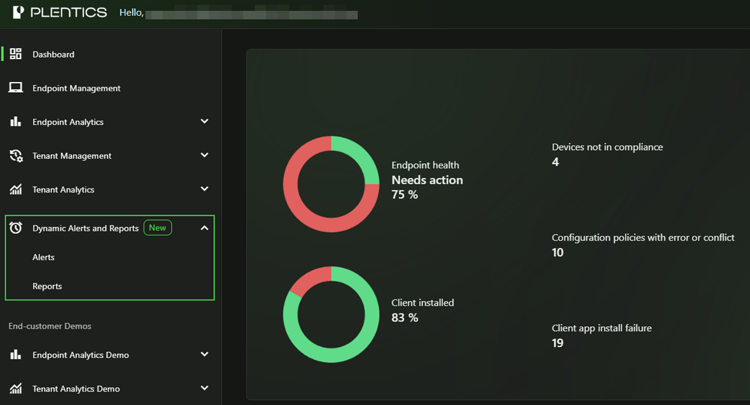
Dynamic Alerts and Reports introduces dedicated catalogue views for both alerts and reports.
Partners can now browse available alerts and reports, filter by scope such as Endpoints or Tenants, see clear descriptions of what each alert or report does, activate alerts and reports directly from the UI, manage applied alerts and reports without separate service requests, and test alerts and reports before using them in production.
The feature is available automatically for partners with Plentics Analytics enabled. This includes partners using Endpoint Analytics, Tenant Analytics, or the bundled Analytics offering.
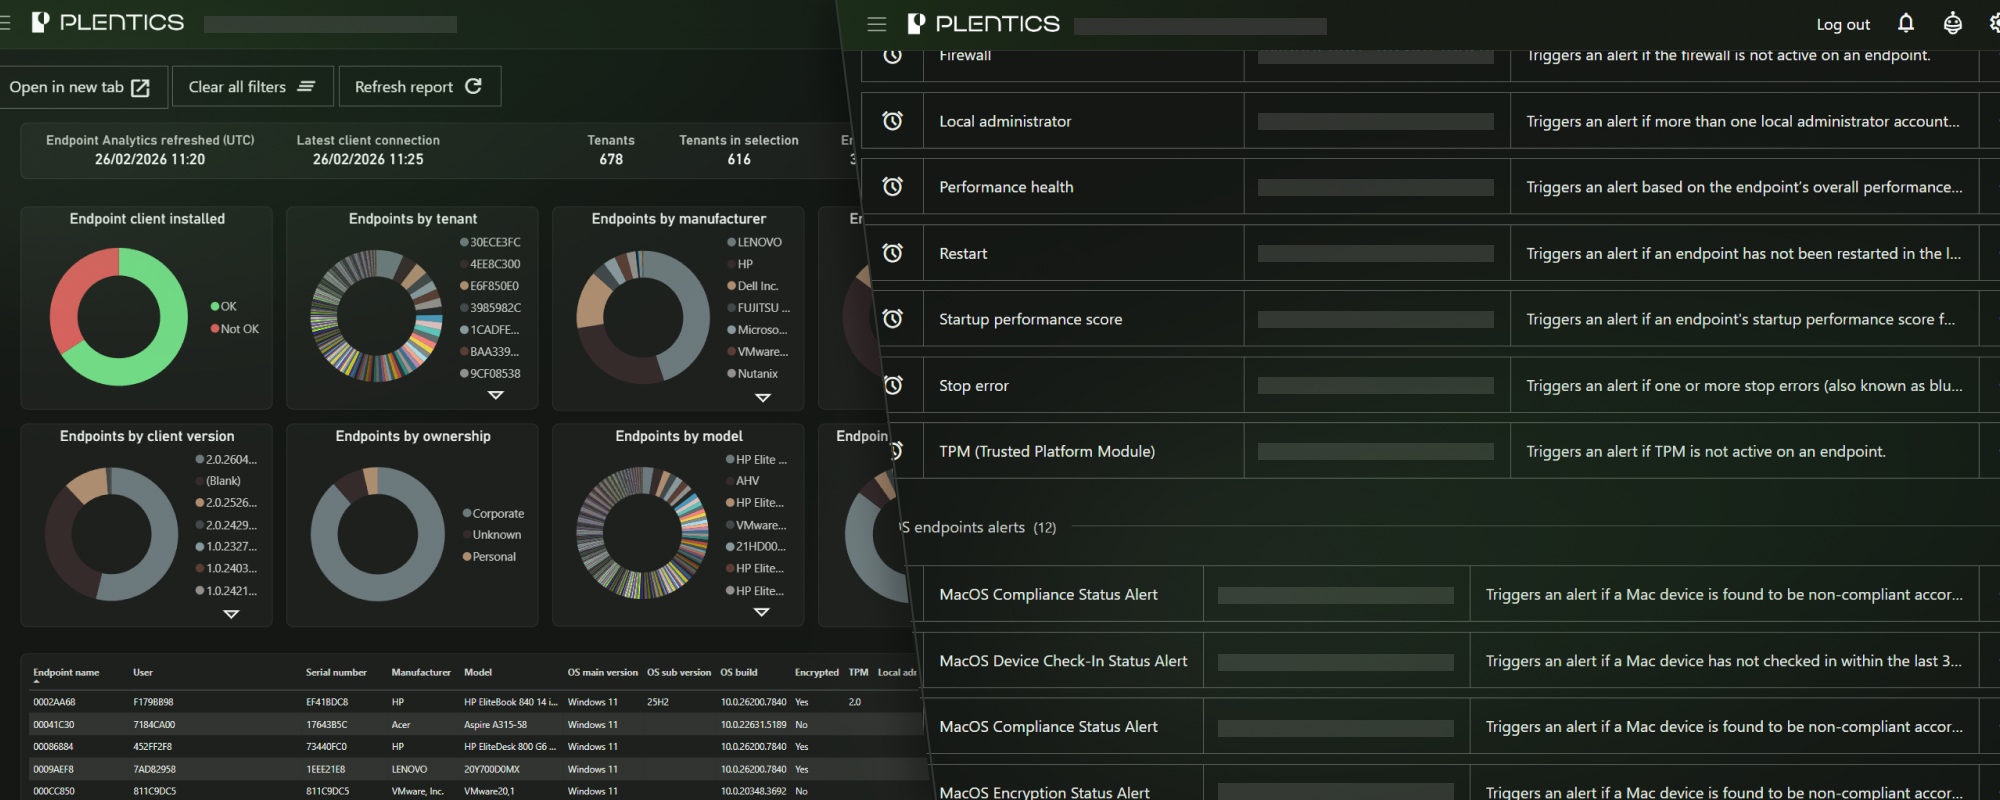
Smarter alerts for proactive MSP operations
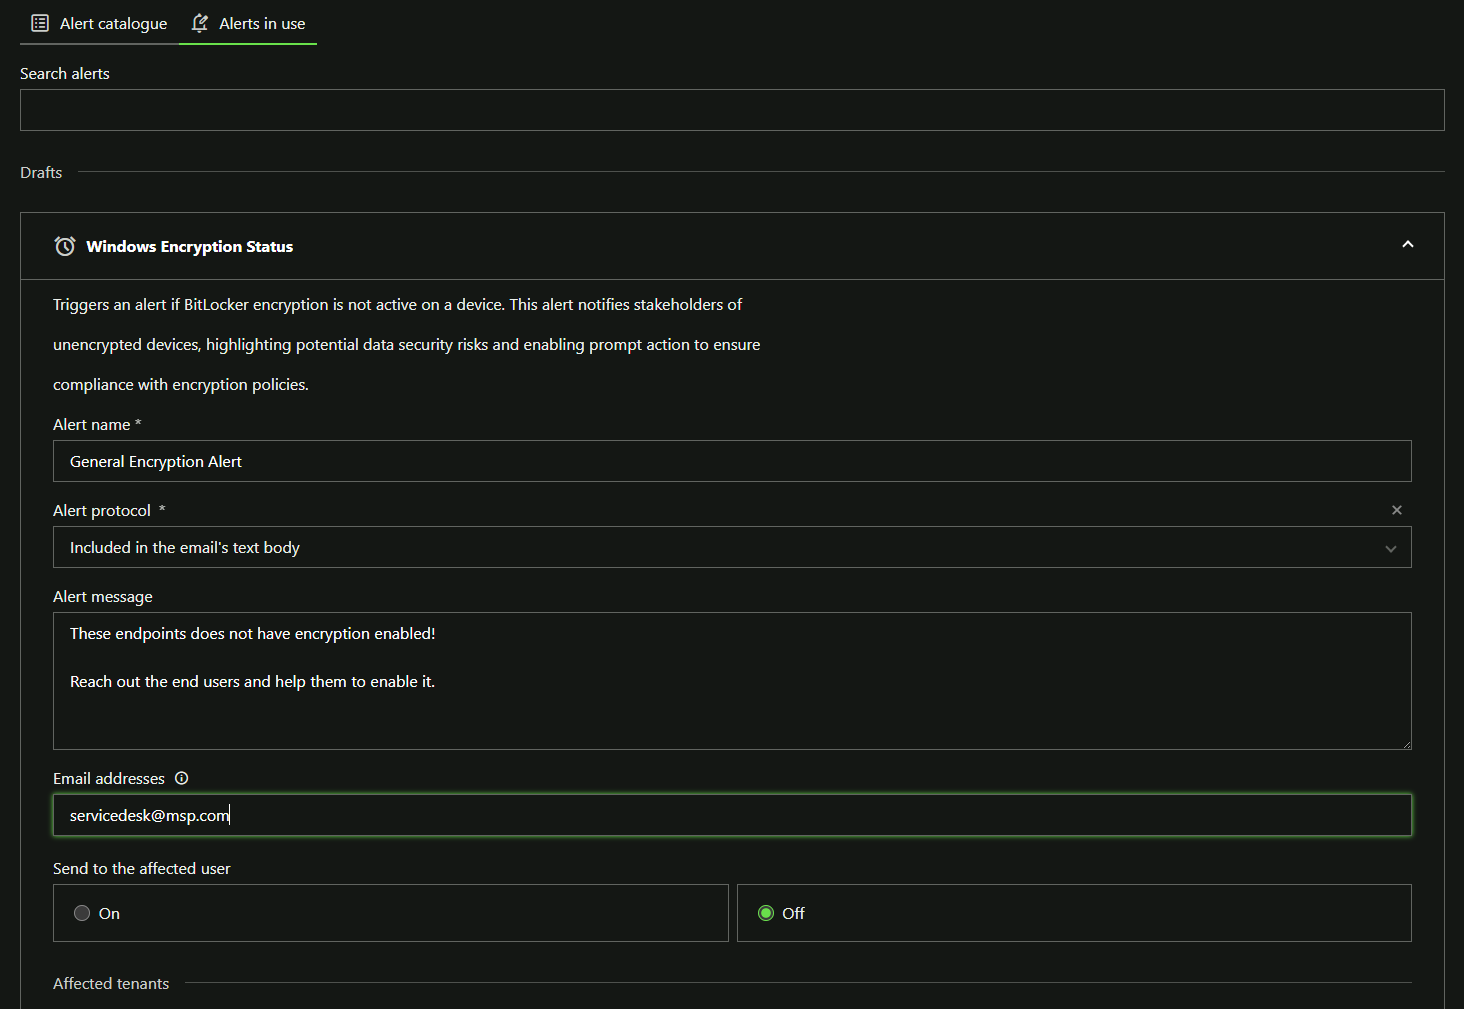
Dynamic alerts help MSPs react faster to relevant changes across customer environments.
Alerts can be configured with parameters that define when they should be triggered. For example, an alert can be based on a security or health-related threshold in the analytics data. Partners can define the recipients, customize the alert message, include the affected device or tenant list in the email body or as an attachment, and choose whether alerts should also be sent to the affected user.
Tenant filtering gives MSPs control over what end customers alerts apply. Alerts can be configured across all current and future tenants, or limited to selected tenants depending on the use case.
For MSPs managing many customer environments, this is a practical way to move from periodic checks to continuous, analytics-driven monitoring.
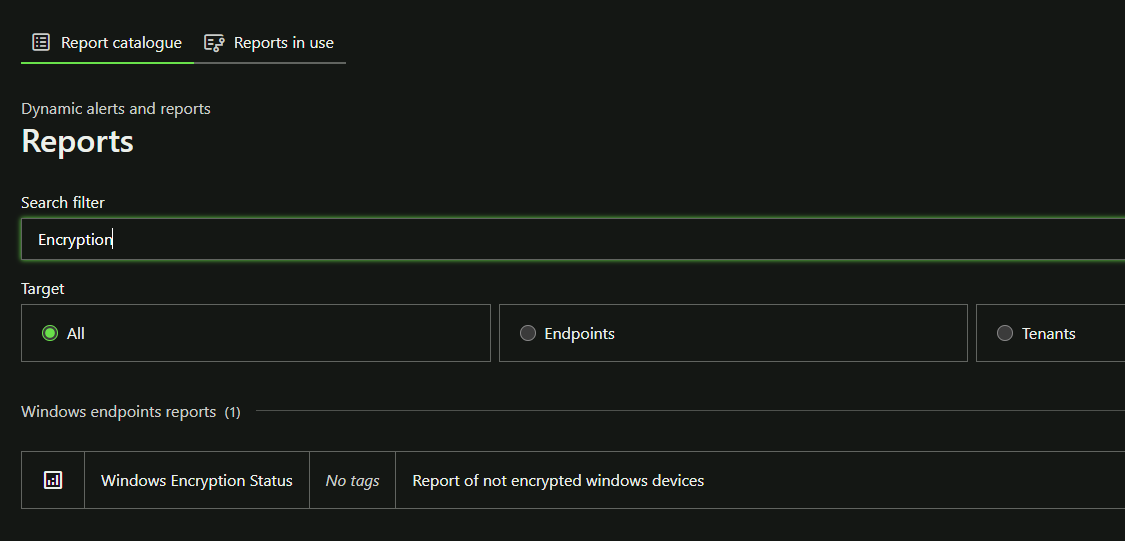
Scheduled reports without manual work
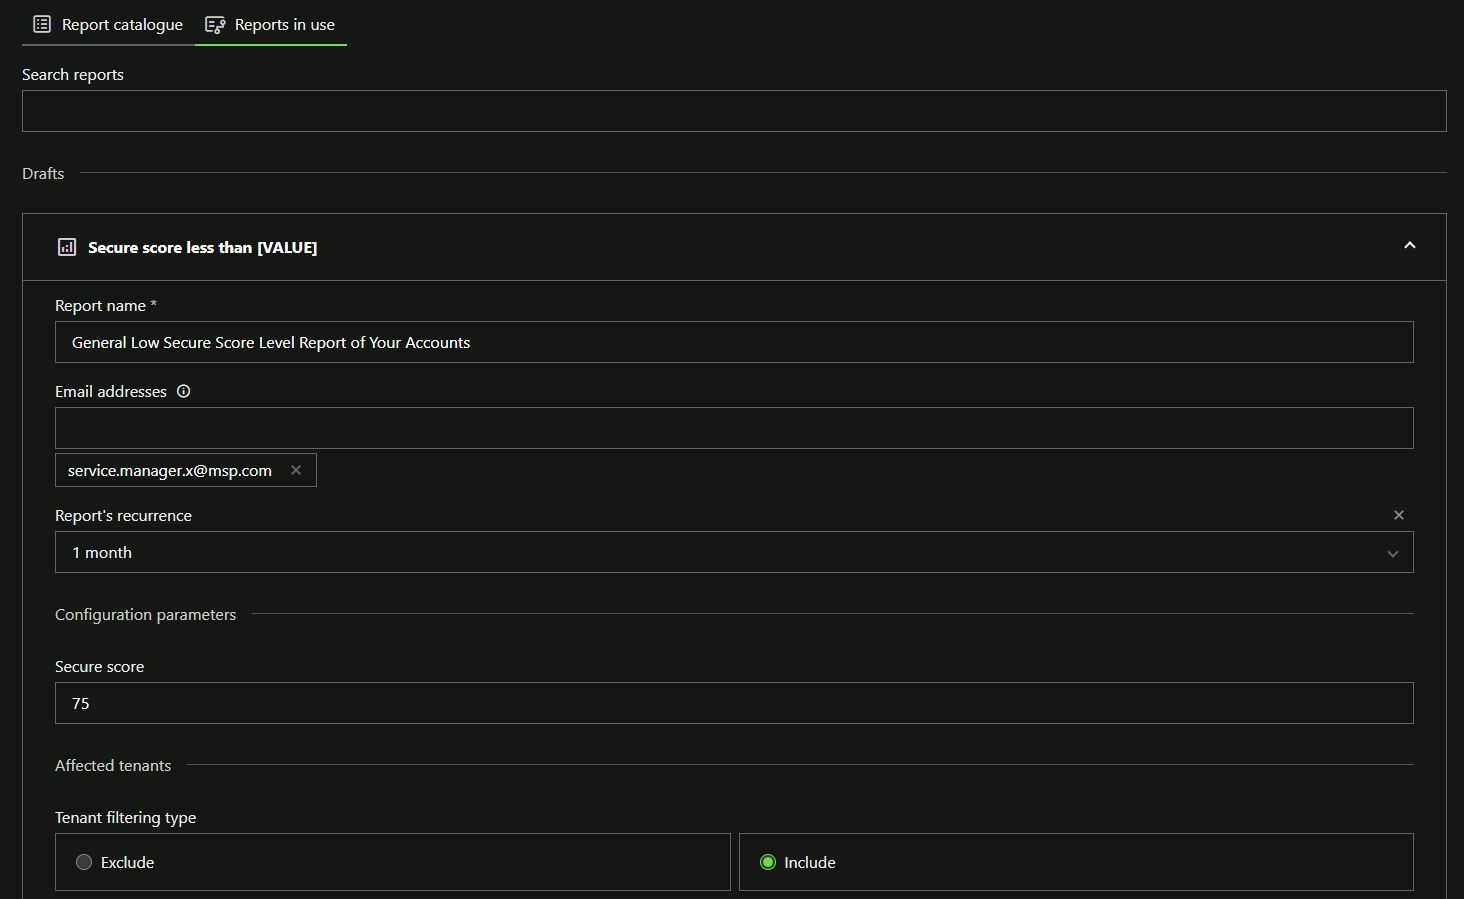
Partners can now subscribe to reports from the report catalogue, configure recipients, define recurrence, and apply tenant-level filtering. Reports can be scheduled to run every 1, 3, or 6 months, depending on the need.
This makes it easier to keep customers updated on endpoint and tenant status without rebuilding the same reports every month.
For customer success, QBRs, security reviews, and recurring service reporting, this creates a more consistent and scalable way to show the value of the MSP’s work.
Built for multi-tenant scale
Dynamic Alerts and Reports is especially valuable in environments where MSPs manage tens or hundreds of Microsoft Intune tenants.
Manual monitoring does not scale. Manual customer reporting does not scale either.
By making alerts and reports dynamic, configurable, and manageable directly from the UI, Plentics helps MSPs standardize how they monitor customer environments and communicate status across their customer base.
The result is more control, less repetitive work, and a clearer path from analytics to action.
Available now
To see how Plentics can help your MSP turn Microsoft Intune and 365 environments and Plentics analytics into proactive operations and automated customer reporting, book a demo.